Intro
This year’s macroeconomics and investment environments were similar to the previous year’s environments. Substantial increase in price levels, high variance of prices, and outstanding geopolitical risks were prevalent. While raw material and refinery export improved compared to the last years, in terms of quantity it was less than their long term averages. After some changes in export procedures by the state, prices of exported petrochemical compared to domestic ones increased and and the gap between the two narrowed. M1 and M2 continued their increase at high rates, and M1 saw unprecedented growth values. This was partly caused by budget deficits and, to some extent, by an increase in banks’ free reserves following slowdowns in economic activity which itself stem from hindering measures aimed at containing the spread of Covid-19. Stock market’s surge continued and higher nominal values were recorded for Overall Index. Yet any expectations of structural changes and imagination that stocks will be valued by considering longer term cash flows deemed to be in vain. Government officials invited people to invest in stock market and the number of investors increased day by day. At August government, social security and corporations related to welfare ministry flooded the local stock market with stocks. Increase in supply or a neglect over market impact effects led to a market crash. Some of the private equity funds had perfect timing before and on the day of the crash.
An event before market crash was a statement by 25 “concerned economist” claiming that stock market “is the cause of the inflation”, and they “urgently demanded” that “a third of government stocks ought to be sold immediately” and that the government could lessen the budget deficit by that. Using back of envelop calculations and considering an average free float of 0.2, the prescribed number was around 7 to 8 percentage of free float of listed stocks in Tehran Stock Exchange. Some of those 25 “economist” have some nice papers in top ten journals. Given their track records, we are still waiting for the proof of their claim that stock market growth leads to inflation. Before and after the advised intervention money multiplier was around 7.5 and it did not changed afterward. Further as basic economic models says, increase in number of transactions has negative effect on price levels, ceteris paribus. Inflation and money supply, which a number of them assertively claimed that it is strictly endogenous, increased after their advice was implemented. This all said, I am one of the economics graduates that still wait for their research papers on this issue. This revolutionary idea of theirs, if proved, is as revolutionary as marginalism revolution in economics. But I wonder how they are going to prove that inflation is not a monetary phenomenon and it is a stock market phenomenon :D I wish them lots of luck for doing the impossible :)
During the performance analysis period, geopolitical risks heightened. USA presidential elections and subsequent change in expectations of future sanction environment was an added uncertainty. mentioned risks and uncertainties, stock market crash, and signs of a stagnant real state market resulted in a 70 percent increase in check-able and redeemable accounts amount in November. This is while inflation was 30.5 percent and saving deposit amount growth was less than 2 percent (numbers are on a 12 month basis, November 2020 compared to November 2021. The numbers for EOY of Iranian calender, 3rd week of March, was 68.6 percent for check-able accounts, 56.6 percent for redeemable accounts, 43 percent for short term saving deposits and negative growth for long term saving deposits, and inflation was 36.2 percent. These changes are in line with the stated conclusion). Talks about lifting sanction with new USA administration began in January and it is still ongoing. After mid-February very strict price limits laws were introduced. Presumably so the newly appointed chief of local Stock Exchange could buy time for decision making by himself and in hope of good news. Which in action eroded market liquidity.
Canceled plans for relocation and the profit opportunity, led me to raise capital for the portfolio. Seeing the imminent crash, I cashed in 6/10 of the equity holding. Predicting the market will fall, and given that the local market almost just has a buy-side, I traded much less and devoted my time to studying for GRE and IELTS exams. There was a possibility of buying put options on some stocks. Those options are neither liquid assets nor most of their writers were institutional. I read that option writers had problems depositing adjusted option margins in August. Hence, I forgo buying put options.
All in all, the structural change that I hoped for did not happen. Secondly, pension funds where better off by selling assets at higher prices.
Lets take a look at performance metrics for this period.
Charts and measurements
Charts: Indices
For comparison I used four of the indexes that are provided by Tehran Stock Exchange. Concise definition of them are:
-
Total Equal weight Pr: Based on prices of listed stocks. Equal weight is given to prices.
-
Overall Index: Based on market cap weighted adjusted prices of listed stocks, dividends and IPOs are included.
-
Top 30 Index: Only includes 30 biggest companies.
-
Top 50 Index: Only includes 30 biggest companies.
Last two indices have survivorship bias. Due to some local market rules, some stocks are closed for trading for specific predefined or unspecific predefined time :) For example after disclosing information, or a fifty percent increase/ decrease in stock price, or reevaluations, they are closed for trading. Being closed for trading could last from several days to a more than a year. Since these indexes are calculated using latest available price, Indices have slightly undervalued variance compared to VLGI. Market cap weighted indices include IPOs from day one of their offering. As a result big cap IPOs strongly influence them. Further the Overall Index, the main Index, includes dividends. IPO of the main fund of Social Security was significant for this Index.
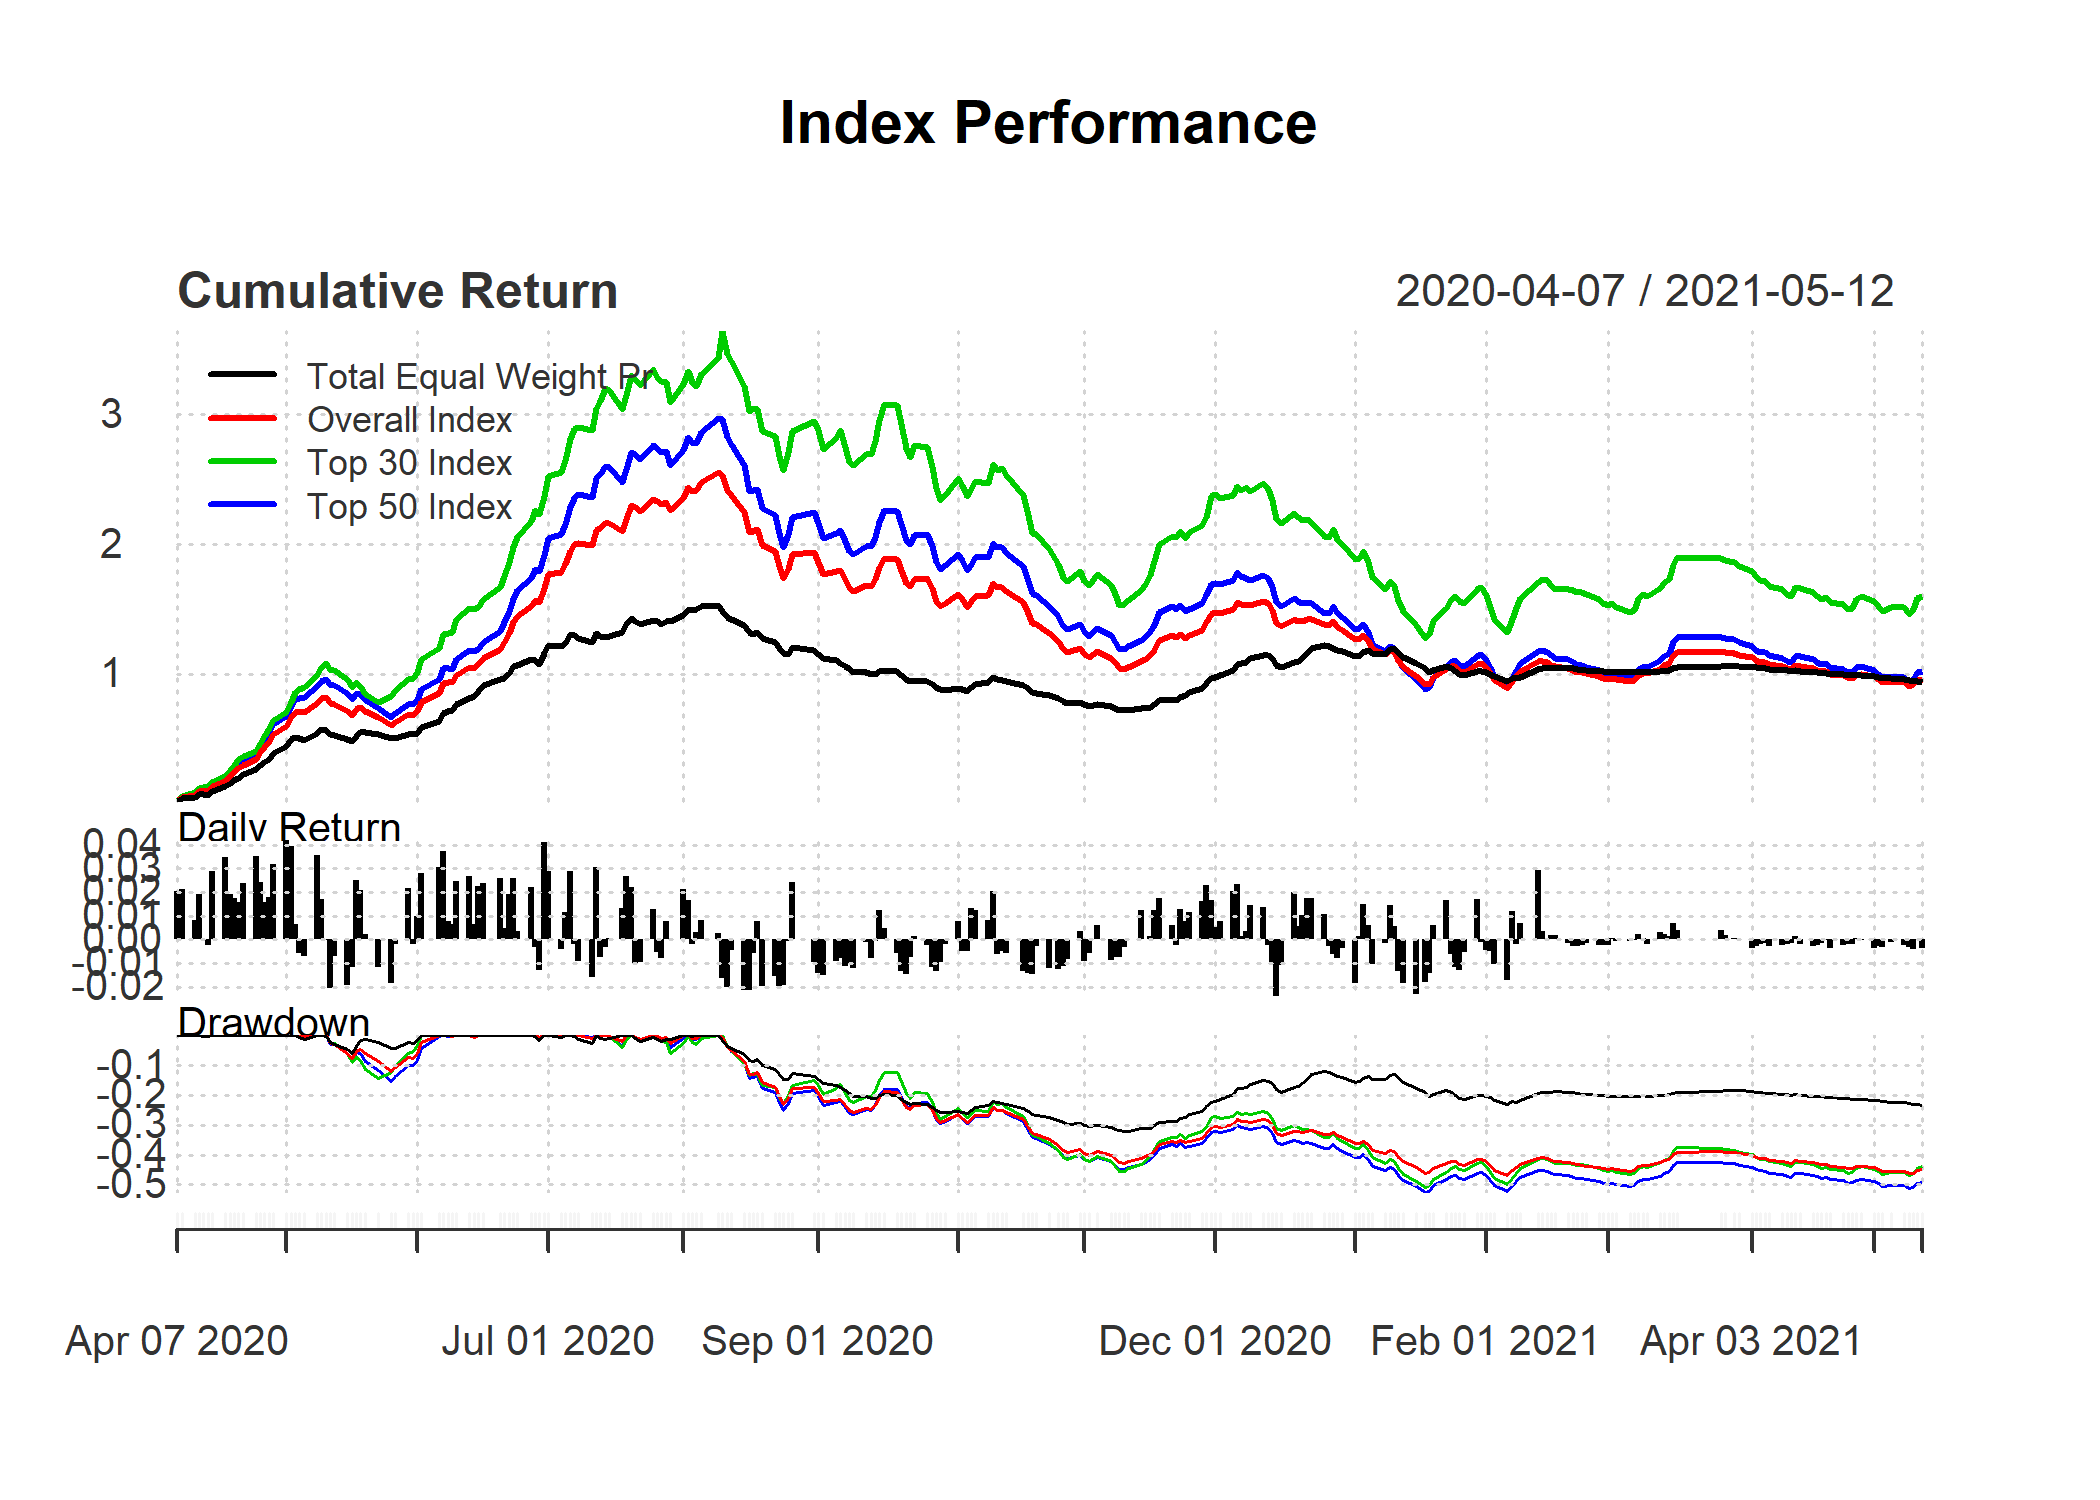
Last year’s observation, divergance between drift term of small and big stocks , continued till mid August. From mid July till mid August, as I mentioned above, around 7-8% of free float of all stocks was sold by big funds, government and welfare ministry subordinates including main fund of Social Security. Main social security fund itself had an IPO in which it offered 10 percent of its existing shares. Since I think social security is based on trust of payers and its main duty is notoriety of investing borrowed money and reducing payers cautionary savings by law of large numbers, I did not consider this an appropriate action. Yet it was done. It’s price 7.6 folded. Main Social Security fund sold 2 more percent of its stocks at higher values and then, as with many other stocks especially big cap ones, its share price sank to 28 percent its highest value.
For comparison purposes and reducing the effects of survivorship bias, the graph presents both the Top 50 Index and Top 30 Index. While starting point and drawdawns of these two indices and Overall Index are almost similar, cumulative returns of Top 50 Index, Overall Index, and Equal weight price index converge to an approximately similar final value. That is to say, some companies did not remain in top 30 market cap list and moved to top 50 one. Having in mind that most of top 30 cap stocks were state related stocks in beginning of the analysis period plus looking at Top 50 Index cumulative returns compared with Top 30 Index, some traders have imagined a case of pump it and dump it. I refrain from this deduction. I mostly think it was the suggestion by those so called “25 concerned economist” that resulted in the crash. Mass selling by entangled institutions was right after their suggestion and the amount of sold stocks matched their prescribed amount. As I said before, I am still waiting for their paper in a reputable journal proving their novel idea that inflation is a stock market phenomenon and not a monetary one :) Who can resist reading such a revolutionary research? :) So much against common sense that even in my wildest imaginations I can never imagine it would even be written what about being published by “25 concerned economist” :D A dark humor is that this kind of advice is common in Tehran academic institutions and no one was ever held responsible for these kind of claims. I hope one day I see the end of self seeking polemics.
Indexes have almost reached to a steady state from mid January. Afterward, as with most other drawdowns, relative price adjustments have begun. It was as I imagined until local stock exchange chief was changed. He introduced +6/-2 percent price limits on daily trading. In local market trades are prioritized based on arrival time of orders. After a few days people who wanted to sell had difficulties selling their stocks. Race to transmit sell limit orders at higher speed at stock market opening began. Liquidity nearly vanished to an extent that on some days aggregate stock market trading volume reached to a twentieth of its value in summer. Market halted and prices fell slowly, but steadily. Although, by new US government attitude toward sanctions and considerable reduction in geopolitical risks stock prices were expected to increase, new price limit rules hindered any foreseeable gains. Contemporaneousness of these two event makes quantitative evaluations of the former effect by using only stock market data very hard.
Another mentionable occurrence was giving rights to sell redistributed stocks in 2006. This farther the sell side pressures in July. Rights to sell was exercised by brokers as investor agents. Most stock price reversals before February was shortly followed by an increase in sell side. At such instances, news about redistributed stocks were usually released after market hours. Due to lack of public data in my hands, I cannot quantify this matter. This data plus data about algos would be pretty informative about continuation of falling prices. While algos could not submit an order after July, they had access to data. Over several occasions, four times, I saw reductions in listed stock prices at almost the same time and much faster than human reaction. In all of those four cases, a slight decrease in demand for one of top 30 cap index was the trigger and massive orders to dump stocks happened in less than 4 minutes. Given that algos are newly introduced to the domestic market, similarity between their strategies and hence their outcome is not a unprecedented occurrence. Anyway, these hypothesizes need data to be more than guesses.
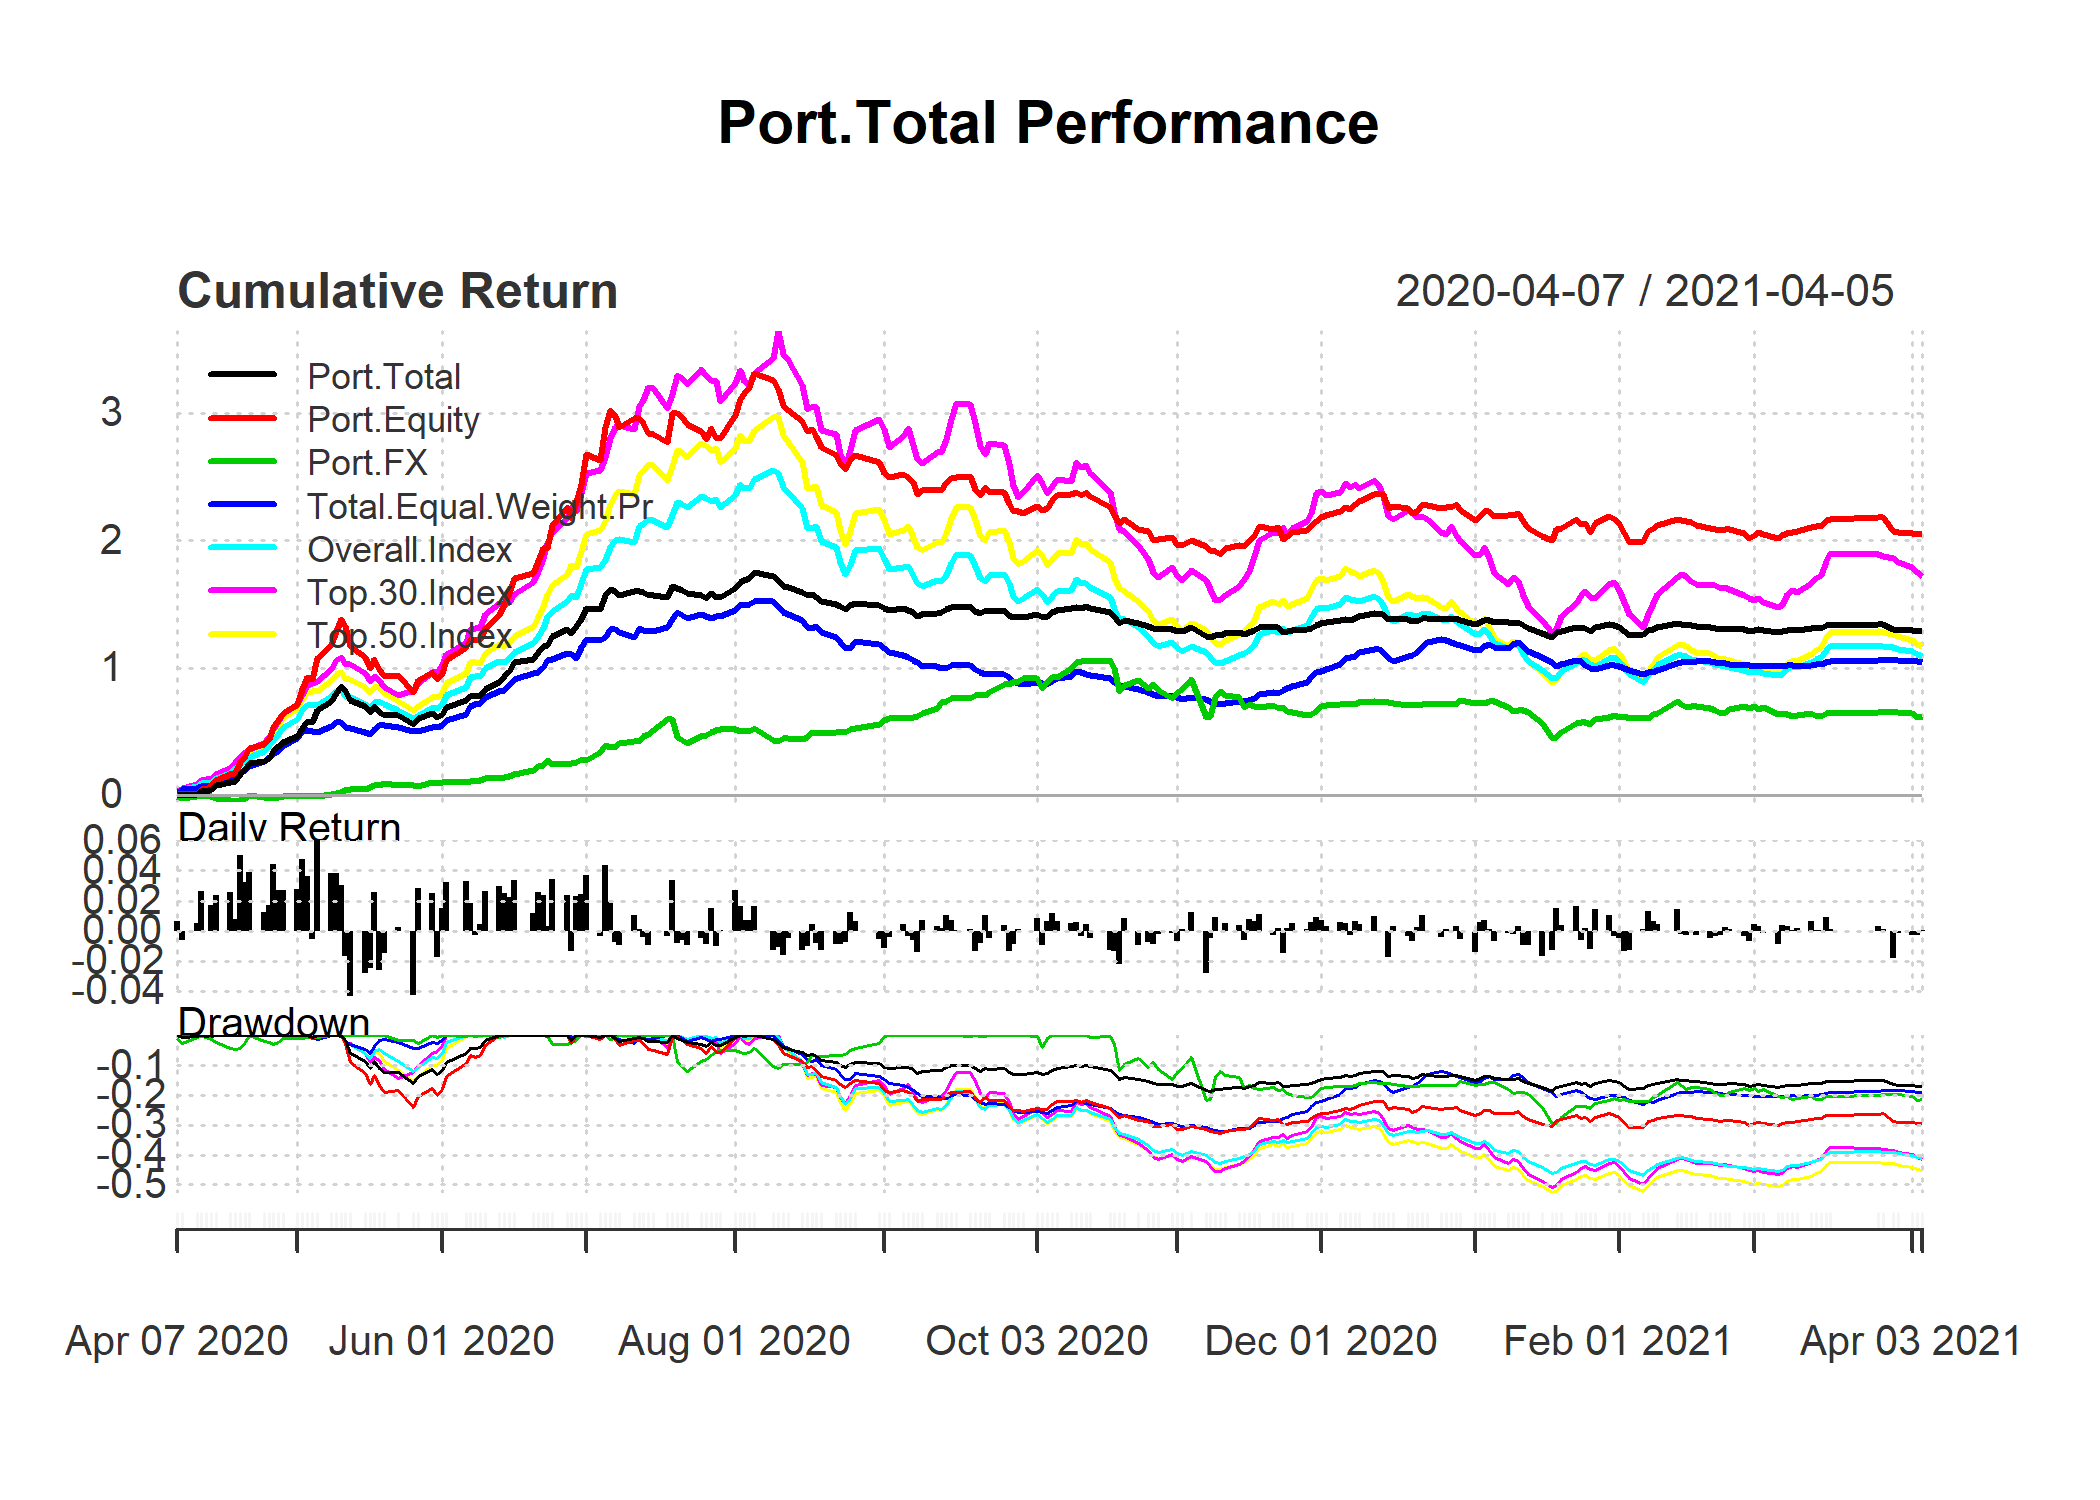
Charts: Portfolio
As the chart shows, equity part of the portfolio performed better than Overall Index and Top 30 Index. negative correlation between foreign exchange component of the portfolio and indexes conditional on external risks seems to reduced overall variation in the portfolio. At the stock market peak, I cashed around six-tenth of the equity part of the portfolio. The cash plus foreign exchange component of the portfolio are the reason that whole portfolio has lower variation than indices. This reduced the drawdown and Total Portfolio has lower drawdown than the indices.
Metrics
Performance metrics for the first period shows a Sharp ratio of 4.86. Standard errors are as intended and combining foreign exchange and equities reduced SE in portfolio to a lower level than Overall Index. Return is around a forth larger than return of Total Equal Weight Price Index.
Sharp ratio, Information ratio and max drawdawn of portfolio are satisfactory compared to indices.I am happy about them :)
Information ratios of indices are also reported. It was not a necessary or an informative act, yet I find the differences interesting. Maybe I make a measure based on them.
| ret | sd | |
|---|---|---|
| Top 50 Index | 1.172 | 0.3886 |
| Top 30 Index | 1.722 | 0.4212 |
| Overall Index | 1.094 | 0.3345 |
| Total Equal Weight Pr | 1.044 | 0.2214 |
| FX | 0.621 | 0.3458 |
| Equity | 2.046 | 0.3759 |
| Total | 1.286 | 0.2412 |
| Sharp Ratio | Upside Potential Ratio | max Drawdown | |
|---|---|---|---|
| Top 50 Index | 2.737 | 1.017 | 0.5253 |
| Top 30 Index | 3.768 | 1.037 | 0.5101 |
| Overall Index | 2.961 | 1.002 | 0.4687 |
| Total Equal Weight Pr | 4.259 | 1.357 | 0.3202 |
| FX | 1.563 | 0.4487 | 0.2962 |
| Equity | 5.043 | 1.068 | 0.3287 |
| Total | 4.861 | 1.107 | 0.1862 |
| Downside Deviation | VaR | ES | |
|---|---|---|---|
| Top 50 Index | 0.01592 | -0.03749 | -0.0479 |
| Top 30 Index | 0.01701 | -0.03993 | -0.05123 |
| Overall Index | 0.01337 | -0.03201 | -0.04097 |
| Total Equal Weight Pr | 0.007304 | -0.0203 | -0.02624 |
| FX | 0.01688 | -0.03423 | -0.0435 |
| Equity | 0.01276 | -0.03476 | -0.04483 |
| Total | 0.007802 | -0.02191 | -0.02837 |
| Free Float Index | Top_50_Index | Top_30_Index | |
|---|---|---|---|
| Information Ratio: Total Equal Weight Pr | 1.395 | 0.5091 | 2.274 |
| Information Ratio: Overall Index | 2.083 | 1.082 | 4.311 |
| Information Ratio: Top 30 Index | -3.04 | -5.092 | NA |
| Information Ratio: Top 50 Index | 0.8439 | NA | 5.092 |
| Information Ratio: Free Float Index | NA | -0.8439 | 3.04 |
| Overall_Index | Total_Equal_Weight_Pr | FX | |
|---|---|---|---|
| Information Ratio: Total Equal Weight Pr | 0.2748 | NA | -1.088 |
| Information Ratio: Overall Index | NA | -0.2748 | -1.066 |
| Information Ratio: Top 30 Index | -4.311 | -2.274 | -2.18 |
| Information Ratio: Top 50 Index | -1.082 | -0.5091 | -1.148 |
| Information Ratio: Free Float Index | -2.083 | -1.395 | -1.509 |
| Equity | Total | |
|---|---|---|
| Information Ratio: Total Equal Weight Pr | 3.414 | 1.19 |
| Information Ratio: Overall Index | 3.218 | 0.7444 |
| Information Ratio: Top 30 Index | 0.9096 | -1.284 |
| Information Ratio: Top 50 Index | 2.717 | 0.3785 |
| Information Ratio: Free Float Index | 2.515 | 0.003827 |
Conclusion
Based on last year conclusion I stopped looking at just annualized Sharp ratio and be happy when it is above two. Standard deviation, Information ratio and Sharp ratio when considered together and calculated by using rolling time windows seem to result better measure of performance at each point. I think that this is still not an optimal performance measure at each point and I feel that it needs to be enhanced.
Another fact that I learned is the importance of increasing assets under management. I have done it and quantified results showed me that it is not in any way less important than other factors like timing, analysis, prospect of assets, risk management, performance analysis, frequency of trading, leverage and network.
Having my GRE and IELTS results, it is probable that I will study Corporate Finance MSc in coming academic year. If Covid-19 situation makes this improbable, then a company will be born :)