Intro
In what follows I try to look at performance metrics of last couple of years. During this time geopolitical risks increased. Price level surged, massive capital outflow made frequent changes in capital outflow controls more than prevalent. Decrease in export of raw materials and sanctions made importing luxury items a luxury. Social security fund got liquidity problems, and the same happened for three main public sector pension funds. M1 and M2 were increasing at high rate, and central bank of Iran said this is necessary for “continuation of banking system activities”. In my idea this is equal to saying that a few banks were more of a Ponzi scheme than bank.In short, sever negative growth coupled with hot money happened. And most interestingly, stock market saw unprecedented nominal values. I decided to move my domicile as geopolitical risk escalated. From about last June/July I had much less time for trading. Due to that the portfolio was mainly consisted of 2-4 blue chip stocks. And well, this new infection was not part of the plan :) After canceled plans for relocating- I already changed my city from near a Gulf to mountainous Tehran- to my utmost surprise, those blue chip stocks prices surged. All things considered, it is likely that a structural change bell is ringing.
Given the situation, I decided to work more than before.Different possible situations need to be considered. First thing is to take a look at performance metrics. Later I will think about whether we will experience three digit inflation or not. Are changes in the way people save for retirement permanent? will reviving banks or pension funds have fewer financial problems? And a lot more.
Charts and measurements
For comparison I used four of the indexes that are provided by Tehran Stock Exchange. Concise definition of them are:
-
Total Equal weight Pr: Based on prices of listed stocks. Equal weight is given to prices.
-
Total Equal weight: Like above, dividends are included.
-
Total Price Index: Based on weighted average of prices of listed stocks.
-
Top 30 Index: Only includes 30 biggest companies.
Last index has survivorship bias. Due to some market rules, some stocks are closed for trading for specific predefined or unspecific predefined time :) For example after disclosing information, or a fifty percent increase/ decrease in stock price, or reevaluations, they are closed for trading. Being closed for trading could last from several days to a more than a year. Since these indexes are calculated using latest available price, Indexes have slightly undervalued variance compared to VLGI.
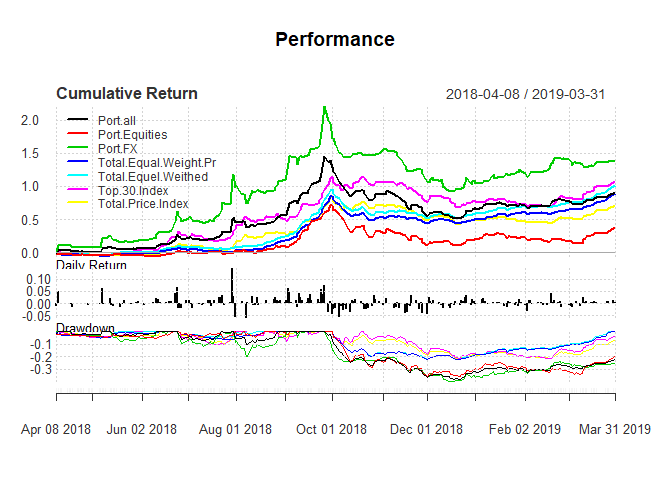
Charts suggest that during second period drift terms of small and big stocks diverged. Further after first nine months, negative correlation between foreign exchange portfolio and indexes conditional external risks has changed. New economic sanctions, imposing sever strains on foreign exchange markets, and substitution of IRR for USD for prudent savings, made changes to mentioned correlation. As an example, more than 1200 goods are not allowed to be imported. For the rest of goods, if they are not “strategic or essential goods”, more than 20-40 percent tariffs are levied. Permissions for importing goods require an extensive bureaucracy too.
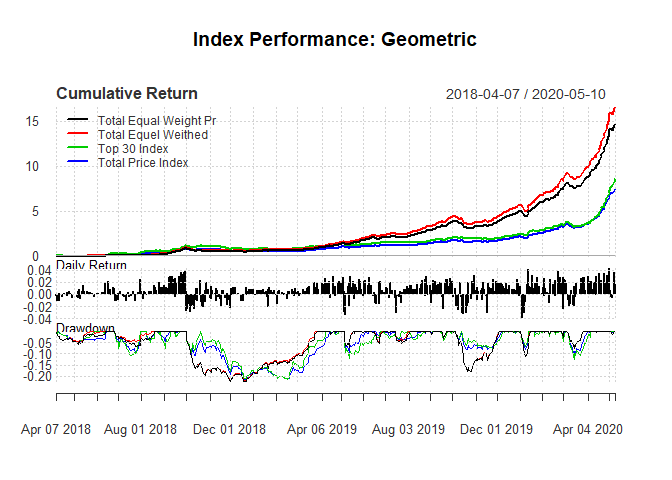
Geometric Vs Arthematic
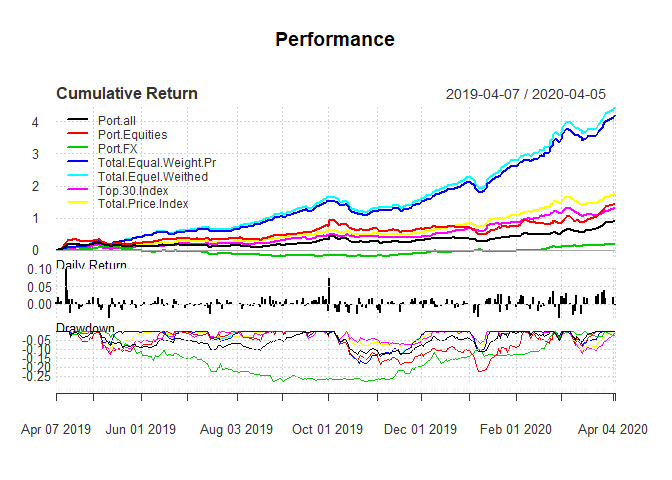
On average stocks growth were higher than average during second twelve months. So for having a little fun the performance charts using both arthematic and geometric methods are calculated. Difference is considerable and cool :)

An interesting thing about drawdowns is difference between small and big companies. several alternative explanations could account for this change.
-
Closing price of a stock is based on Volume Weighted Average Price (VWAP) times a ratio less than or equal to one. This ratio is derived by maximum of dividing each day’s volume by a percentage of total number of shares of the company and/or one. In other words, higher daily volume is needed to achieve the same ratio for big-cap companies.
-
very high tariffs on imports and other import restrictions, small firms faced less competition and their profits increased and/or they escaped bankruptcy. Bigger companies are usually in mining, petrochemicals, refineries and metals. All of them face international competitions and have no pricing power.
-
Several banks are among big-cap. Since interest rates are fixed, and because of an increase in velocity of money, their profit may have increased. After I decided to shift to blue chips, I chose them as blue chip stocks .
-
Due to changes of reevaluation of book value laws, companies began to do it. Subsequently, change in book-to-market ratio happened. For some firms, fixed asset values became twenty fold higher. Most companies in top30 index still had not done it.
Metrics
2018-04-05 : 2019-04-05
Performance metrics for the first period shows a Sharp ratio of 2.4. About 40 percent of portfolio stocks were closed for trading at latest date. last available price on the stock were used to calculate metrics. Standard errors are as I wanted and combining foreign exchange and equities reduced SE. Return was around a forth larger than return of main market index.
| ret | sd | |
|---|---|---|
| Total Price Index | 0.6987 | 0.2203 |
| Top 30 Index | 1.058 | 0.2639 |
| Total Equel Weithed | 1.015 | 0.1745 |
| Total Equal Weight Pr | 0.8897 | 0.175 |
| FX | 1.381 | 0.4876 |
| Equity | 0.3733 | 0.291 |
| Total | 0.9001 | 0.3265 |
| Sharp Ratio | Upside Potential Ratio | |
|---|---|---|
| Total Price Index | 2.706 | 0.8663 |
| Top 30 Index | 3.538 | 0.9021 |
| Total Equel Weithed | 5.12 | 0.8788 |
| Total Equal Weight Pr | 4.432 | 0.8865 |
| FX | 2.538 | 0.6242 |
| Equity | 0.9978 | 0.6732 |
| Total | 2.405 | 0.8111 |
| Information Ratio | |
|---|---|
| Total Price Index | NA |
| Top 30 Index | 4.474 |
| Total Equel Weithed | 2.222 |
| Total Equal Weight Pr | 1.342 |
| FX | 1.327 |
| Equity | -1.351 |
| Total | 0.6268 |
| max Drawdown | Downside Deviation | VaR | |
|---|---|---|---|
| Total Price Index | 0.2197 | 0.008441 | -0.02107 |
| Top 30 Index | 0.2166 | 0.009803 | -0.02486 |
| Total Equel Weithed | 0.2212 | 0.006344 | -0.01553 |
| Total Equal Weight Pr | 0.2239 | 0.006437 | -0.01585 |
| FX | 0.3984 | 0.01631 | -0.04766 |
| Equity | 0.3561 | 0.0129 | -0.02939 |
| Total | 0.382 | 0.01202 | -0.03176 |
| ES | |
|---|---|
| Total Price Index | -0.02701 |
| Top 30 Index | -0.03197 |
| Total Equel Weithed | -0.02023 |
| Total Equal Weight Pr | -0.02057 |
| FX | -0.06081 |
| Equity | -0.03724 |
| Total | -0.04057 |
2019-04-06 : 2020-04-05
Sharp ratio for this period is 3.2. Yet compared to Sharpe ratio of index it is not satisfactory. As said above, after about first third of this time I shift to blue chip stocks to reduce risks. Due to increased tension, I did not wanted to be exposed to less liquidity as I mentioned in this post.
| ret | sd | |
|---|---|---|
| Total Price Index | 1.771 | 0.2178 |
| Top 30 Index | 1.31 | 0.2377 |
| Total Equel Weithed | 4.483 | 0.2368 |
| Total Equal Weight Pr | 4.227 | 0.2369 |
| FX | 0.1733 | 0.2116 |
| Equity | 1.42 | 0.3547 |
| Total | 0.9124 | 0.2462 |
| Sharp Ratio | Upside Potential Ratio | |
|---|---|---|
| Total Price Index | 7.366 | 0.6757 |
| Top 30 Index | 4.925 | 0.7146 |
| Total Equel Weithed | 17.54 | 0.8003 |
| Total Equal Weight Pr | 16.51 | 0.7829 |
| FX | 0.4837 | 0.5726 |
| Equity | 3.591 | 0.9128 |
| Total | 3.237 | 0.8949 |
| Information Ratio | |
|---|---|
| Total Price Index | NA |
| Top 30 Index | -6.616 |
| Total Equel Weithed | 22.51 |
| Total Equal Weight Pr | 20.47 |
| FX | -5.398 |
| Equity | -1.15 |
| Total | -3.842 |
| max Drawdown | Downside Deviation | VaR | |
|---|---|---|---|
| Total Price Index | 0.111 | 0.008734 | -0.01875 |
| Top 30 Index | 0.123 | 0.009815 | -0.02161 |
| Total Equel Weithed | 0.1795 | 0.008851 | -0.01788 |
| Total Equal Weight Pr | 0.1801 | 0.008922 | -0.0181 |
| FX | 0.2778 | 0.009275 | -0.0217 |
| Equity | 0.2211 | 0.01251 | -0.0337 |
| Total | 0.1412 | 0.009057 | -0.0233 |
| ES | |
|---|---|
| Total Price Index | -0.02462 |
| Top 30 Index | -0.02803 |
| Total Equel Weithed | -0.02426 |
| Total Equal Weight Pr | -0.02449 |
| FX | -0.02741 |
| Equity | -0.04327 |
| Total | -0.02994 |
Conclusion
I usually have an eye on portfolio’s Sharpe ratio. If it was around two, I have the luxury for extra time: extra sports, road trips and oil painting. Above performance suggest that I need at least another metric that could tell me more about the portfolio during bull market coupled with inflation. This metrics require to take into account Tehran stock exchange regulations and structure. Being closed for trading, slightly better real-time comparison without loosing flexibility, and regard for effects of accounting time period, need to be adressed. I will make some random portfolios, read a little and see whether I can find a measure for future use.