External facors
In last post I show that some external factors like sanctions, lifting them, and expectations about them could lead to sharp and extreme reaction in Tehran Stock Exchange. Absence of short selling, options and futures on Forex, makes it pretty difficult to hedge against these extreme and frequent drawdowns. These could easily damage any retirement account, mine is not excluded. So, I thought about how to hedge my account against them, and it took me some time to get to a desirable results.
My observations about this matter is as follows:
- I am a resident of Tehran, as a result I have no access to
international markets
- liquid tradeable assets are Foreign Exchange, gold, bond with Rial numerair and Stocks
- Regional Economy is highly depended on oil exports and as a result dollar reserves
- External factors that are bad for economy have several results:
- Export oriented companies have difficulties
- Export and import companies gain from barter transactions
- Last two depends o whether they are subject to sanctions or not
- What is bad for companies means less supply for foreign exchange and subsequently devaluation of Rial
- Both Forex and stock market could be manipulated by authorities sooner or later
I could consider these and AHA why not seeing the relationship between lags and leads of USDIRR and VLGI? By the way my numeraire is Rial, so there would not be much hassle to consider USDIRR and it is by PPP immune to inflation in long run. So lets put another brick in the wall.
Data
Getting data for USDIRR is a bit tricky. First of all, we need to take the “free market rate” and not the official rates for that, the second is not simply tradable for individuals like me. http://demru.com/fa/index provide some old dated data. For completing it I used “RSelenium” to extract each days data from http://www.sanarate.ir/ and combining it together. This second source is much more exact than the first, yet it has its hassle and needs Selenium for getting the data.
path = "C:/Users/msdeb/Documents/Stock and trades/"
setwd(path)
load(".RData")

source("C:/Users/msdeb/Documents/Stock and trades/functions.R")

index.VLGI<- index.maker(WDATA. = WDATA, WDATA_last. = WDATA_last)
index.VLGI<- as.data.frame(index.VLGI)
index.VLGI$DATE <- as.Date(index.VLGI$DATE)
index.VLGI<- as.xts(index.VLGI$VLGI, order.by = index.VLGI$DATE)
colnames(index.VLGI)<- c( "VLGI")
summary(index.VLGI)

X_rates63<- read.csv("C:/Users/msdeb/OneDrive/data/Forex/usdirr63.CSV")
colnames(X_rates63)<- c("DATE", "ind")
X_rates63$DATE <- as.Date(X_rates63$DATE, "%Y/%m/%d")
X_rates63<- as.xts(X_rates63$ind, order.by = X_rates63$DATE)
colnames(X_rates63)<- c( "USD")


X_rates<- read.csv("C:/Users/msdeb/OneDrive/data/Forex/sana_rates.CSV")

# 24:00 stands for all day average

hours_average<- c("08:00","09:00", "10:00", "11:00", "12:00", "13:00", "14:00", "15:00", "16:00"
                  , "17:00", "24:00")
X_rates_hourly<- cbind(X_rates, hour= hours_average )
X_rates_16<- subset(X_rates_hourly, X_rates_hourly$hour == c("16:00"))
X_rates_24<- subset(X_rates_hourly, X_rates_hourly$hour == c("24:00"))
X_rates_16[,1]<-as.Date(X_rates_16[,1], "%m/%d/%Y")
X_rates_24[,1]<-as.Date(X_rates_24[,1], "%m/%d/%Y")

USDIRR_16<- X_rates_16[,c(1:2)]
USDIRR_16<- as.xts(USDIRR_16$USD, order.by = USDIRR_16$X)
colnames(USDIRR_16)<- c( "USD")
USDIRR_24<- X_rates_24[,c(1:2)]
USDIRR_24<- as.xts(USDIRR_24$USD, order.by = USDIRR_24$X)
colnames(USDIRR_24)<- c( "USD")
USDIRR16<- rbind(X_rates63['::2015-06-19'],USDIRR_16)
USDIRR24<- rbind(X_rates63['::2015-06-19'],USDIRR_24)


dataDI<- merge.xts(USDIRR24,index.VLGI)
tail(dataDI)

plot.xts(log(dataDI$USD), main =  "USDIRR")

path = "C:/Users/msdeb/Documents/Stock and trades/"
setwd(path)
save.image()
Here is what the USDIRR from these two sources looks like (yes! we need logarithmic scale for it :) :
tail(USDIRR24)

##                USD
## 2016-12-23      NA
## 2016-12-24 39796.5
## 2016-12-25 40365.0
## 2016-12-26 40716.5
## 2016-12-27 41155.0
## 2016-12-28 40878.0

plot.xts(log(dataDI$USD), main =  "log USDIRR")
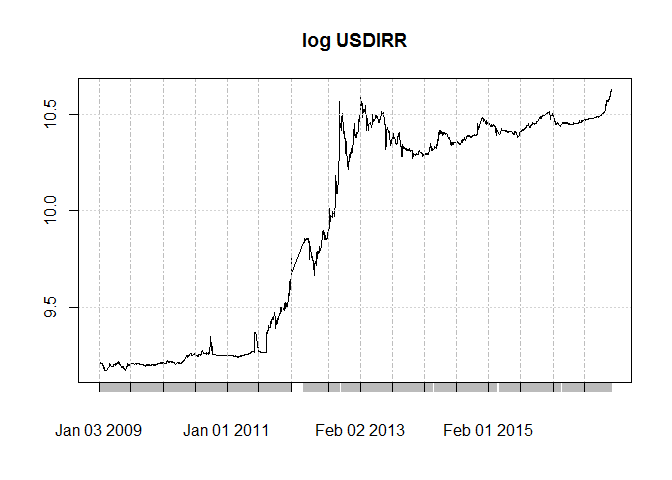
We clearly see structural breaks in this series, and the cause is existence of system of different exchange rates (official or fee market), or system of pegged foreign exchange rate. As a result I would use the data after “2009-01-01” so the structural breaks would not be a problem. After this date free market rate and official one shows differences.
negative relation
dataDI<- dataDI[complete.cases(dataDI$VLGI),]
dataDI<- dataDI[complete.cases(dataDI$USD),]
dataDI$DUSD<- diff(log(dataDI$USD))
dataDI$DVLGI<- diff(log(dataDI$VLGI))

attr(dataDI, "frequency") <- 1
dataDI<- dataDI['2009-01-01::']

# monthly data
mdataDI<- cbind(to.monthly(dataDI$USD)[,4],to.monthly(dataDI$VLGI)[,4])
colnames(mdataDI)<- colnames(dataDI)[1:2]
mdataDI$DUSD<- diff(log(mdataDI$USD))
mdataDI$DVLGI<- diff(log(mdataDI$VLGI))

# adding lags


mdataDI$L_3DUSD<- (lag.xts(mdataDI$DUSD, k = 3))
mdataDI$L_2DUSD<- (lag.xts(mdataDI$DUSD, k = 2))
mdataDI$L_1DUSD<- (lag.xts(mdataDI$DUSD, k = 1))
mdataDI$L1DUSD<- (lag.xts(mdataDI$DUSD, k = -1))
mdataDI$L2DUSD<- (lag.xts(mdataDI$DUSD, k = -2))
mdataDI$L3DUSD<- (lag.xts(mdataDI$DUSD, k = -3))

dataDI<- dataDI[complete.cases(dataDI$DVLGI),]
mdataDI<- mdataDI[complete.cases(mdataDI$DVLGI),]
Now I need to condition the data based on the times that market return was negative. This include negative return that are more inclusive than just negative returns based on external factors. We do that and compute HAC standard errors for OLS.
| Estimate | Std. Error | t value | Pr(>|t|) | |
|---|---|---|---|---|
| L3DUSD | -0.4157 | 0.1179 | -3.527 | 0.00142 |
| Observations | Residual Std. Error | R2 | Adjusted R2 |
|---|---|---|---|
| 30 | 0.05132 | 0.3002 | 0.2761 |
| Estimate | Std. Error | t value | Pr(>|t|) | |
|---|---|---|---|---|
| L_3DUSD | -0.4644 | 0.1871 | -2.482 | 0.0189 |
| Observations | Residual Std. Error | R2 | Adjusted R2 |
|---|---|---|---|
| 31 | 0.05541 | 0.1703 | 0.1427 |
##
## t test of coefficients:
##
##         Estimate Std. Error t value Pr(>|t|)
## L_3DUSD -0.46441    0.19014 -2.4425  0.02069 *
## ---
## Signif. codes:  0 '***' 0.001 '**' 0.01 '*' 0.05 '.' 0.1 ' ' 1

##
## t test of coefficients:
##
##         Estimate Std. Error t value  Pr(>|t|)
## L3DUSD -0.415719   0.075202  -5.528 5.855e-06 ***
## ---
## Signif. codes:  0 '***' 0.001 '**' 0.01 '*' 0.05 '.' 0.1 ' ' 1
So we see negative relation that is significant for lag and leads of 3 months.
Conclusion
My guesses are not rejected and the VLGI could be hedged by using USDIRR. It need a pretty active monthly management since movement in USDIRR could be sooner or later than the shocks in VLGI (it could be figured out by looking at the news and seeing were authorities have intertwined firstly).